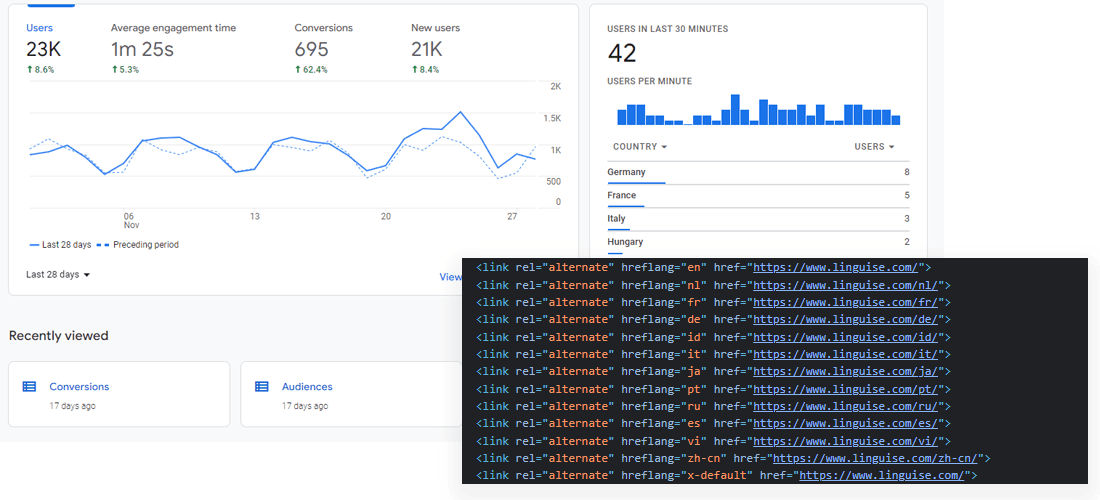
First there’s a good news, Google Analytics or any other statistic tracking will work by default with Linguise neural machine translation. We are generating SEO friendly multilingual URLs associated with canonical and alternate URLs. That’s all is required for your multilingual pages to be indexed.
In a word, if Google Analytics is enabled on your website, multilingual visits will be tracked right away after multilingual pages are generated by Linguise.
Google Analytics v4 data offer 2 main tools to consult your traffic data, through the left menu called “Reports” with pre-made reports and the “Explore” with custom reports.
Let’s dig in those pre-defined reports what multilingual information you can find.
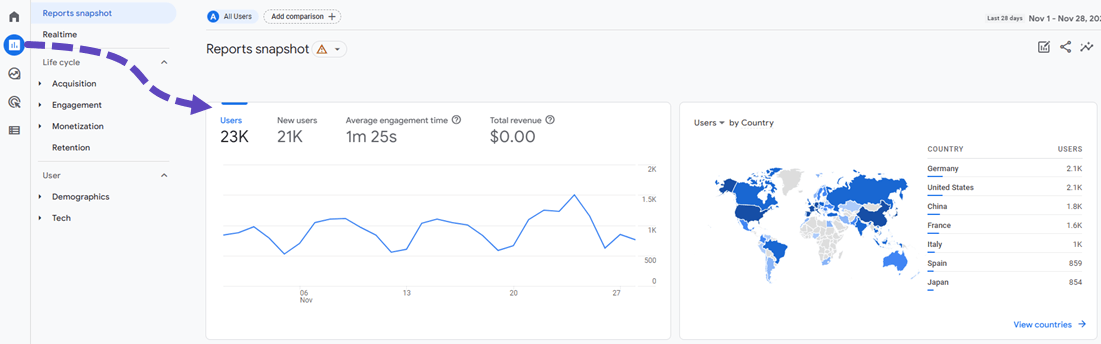
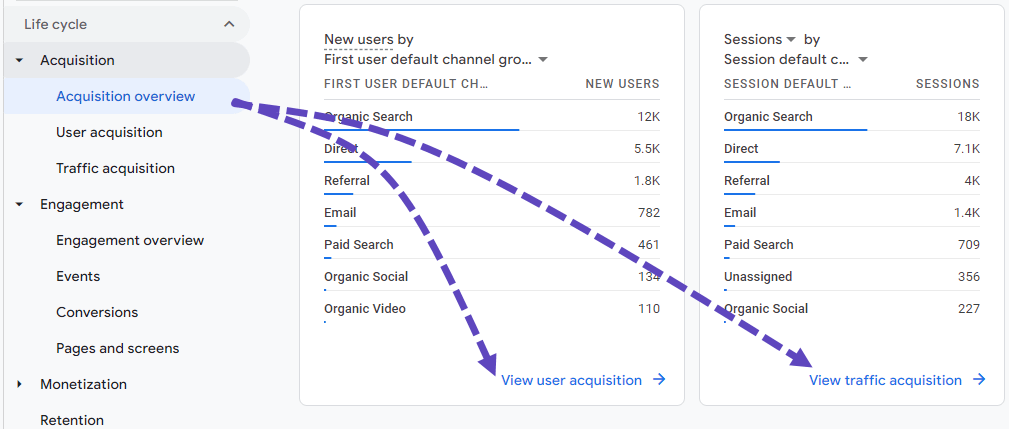
In the Google Analytics v4 reports the first view you’ll find are the acquisition information and the engagement data. From there you can click on it to get a detailed table. In some of them you’ll be able to add multilingual statistics such as geolocation or language information.
Every dashboard report you have can be saved and is dynamically updated by Google depending on your traffic, so it may be different from our screenshots.
From there, in each table you can add a new dimension to your data by clicking on the “+”. For example, here, I’ve added the country in the organic traffic acquisition.
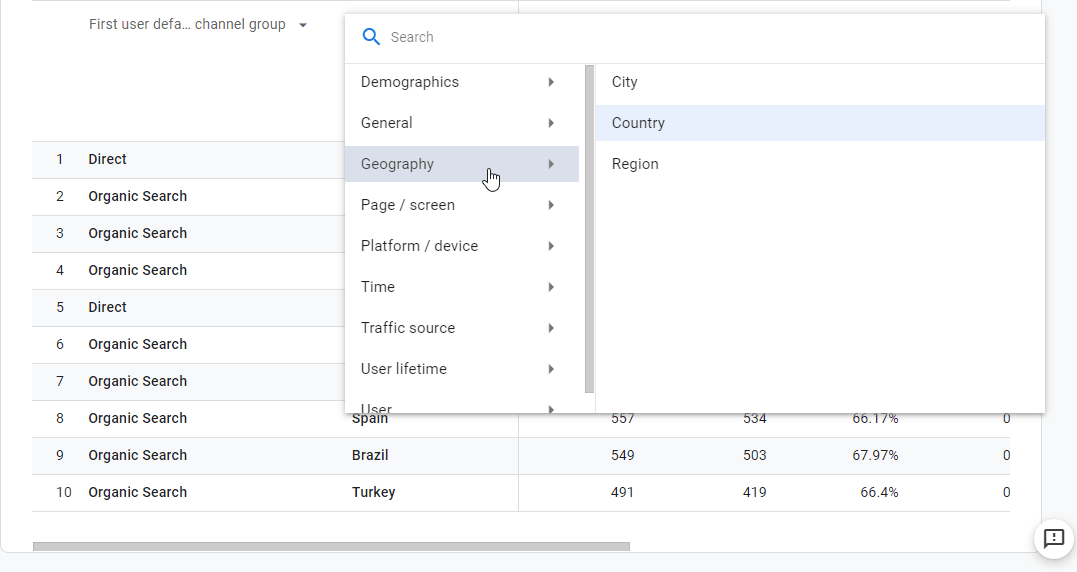
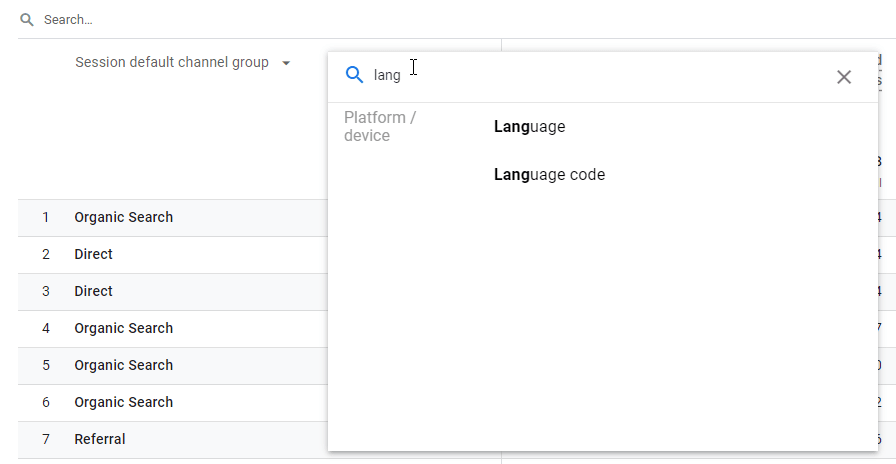
This is also in this place that you’ll be able to add language information.
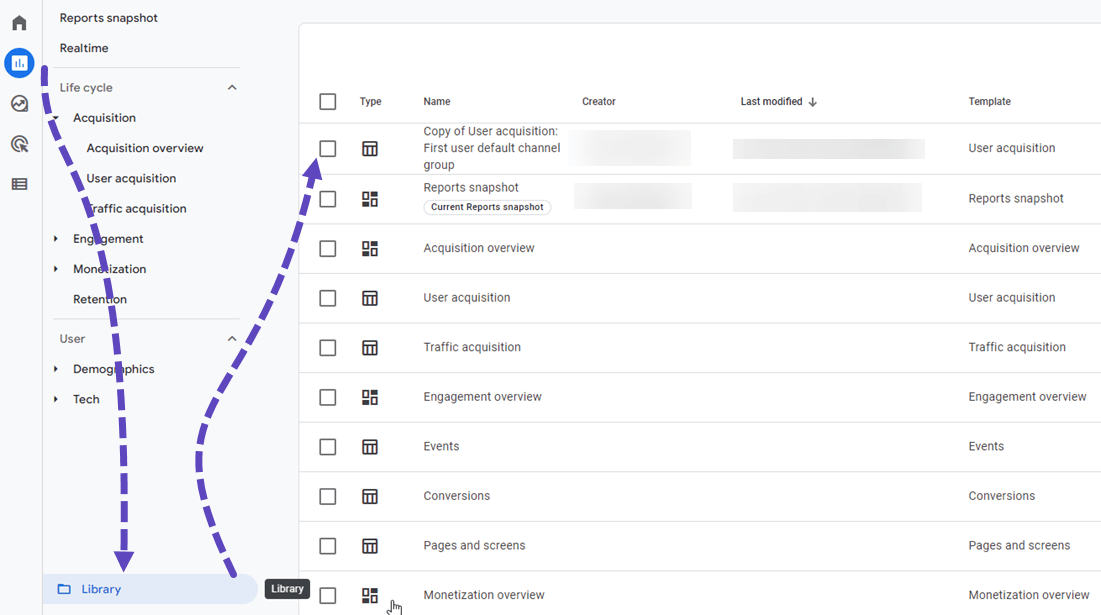
Also in the top-right corner you have the option to save the report you’ve just modified, as a new report or edit the default view in your report. Finally, in the bottom-left corner, you’ll be able to find your custom reports in the library.
Google Analytics claims to track the “preferred language”, not all languages that visitors have configured on their computers. This implies that they get information from the Accept-Language header. For example, if I speak French, I can setup my browser language to French from France or French from Canada or just… French
To get details about that, add “language code” to your statistic table. This is what is tricky with the usage of multilingual statistics by language, one language can have 10 entries.
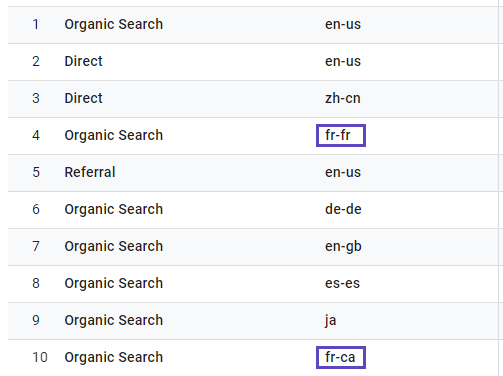
In this example: I have two organic traffic data with French language from France (fr-fr) and one from Canada (fr-ca).
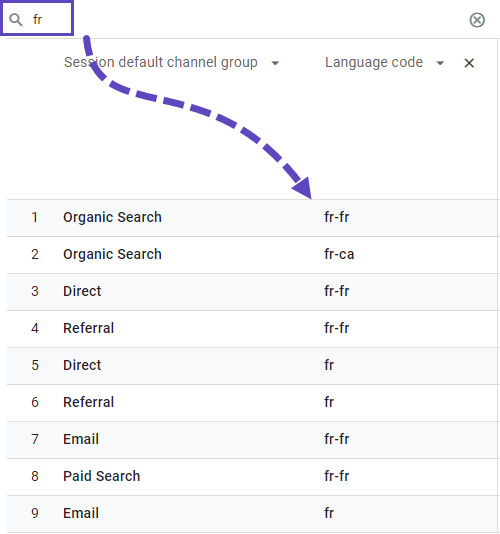
In order to filter all french language browsers, you can use the basic filter. Linguise won’t generate sub language tags like fr-ca, the language will be set to fr and the French Canadian will see be able to read it anyway and it’ll be indexed for them in search engines.
The location is something different from the language, it’s the country, region, city where the visitor originated from. You can perform well in Spanish language but not very well in Spain if you have all your Spanish visitors from South America.
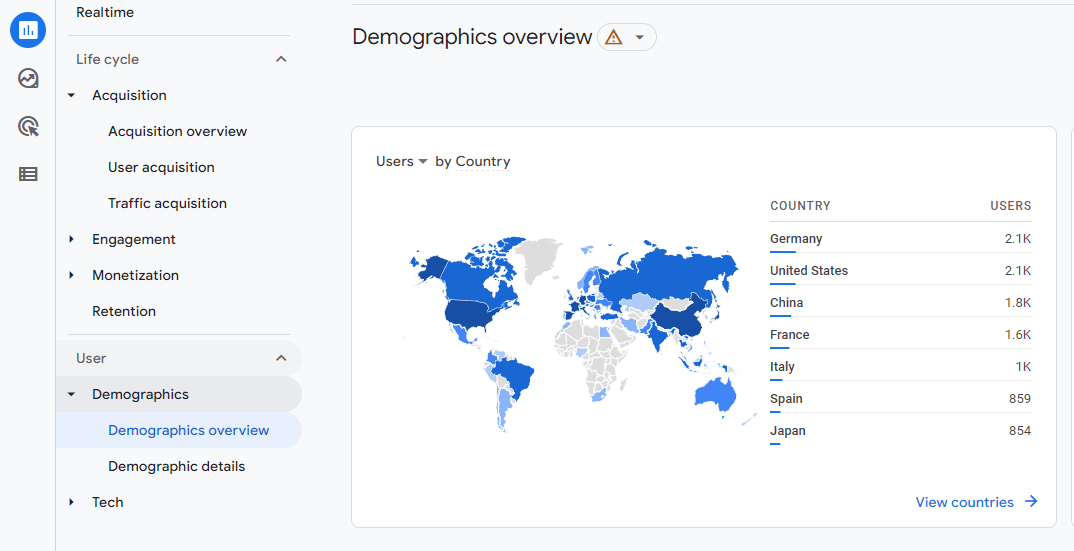
We’ve seen that we can add the country, region of the users in your default traffic statistics but there’s dedicated reports for that are available in the left menu Report > Demographic > Demographic overview
And you can mix both visit by country and language. To do that select a country + language or language code
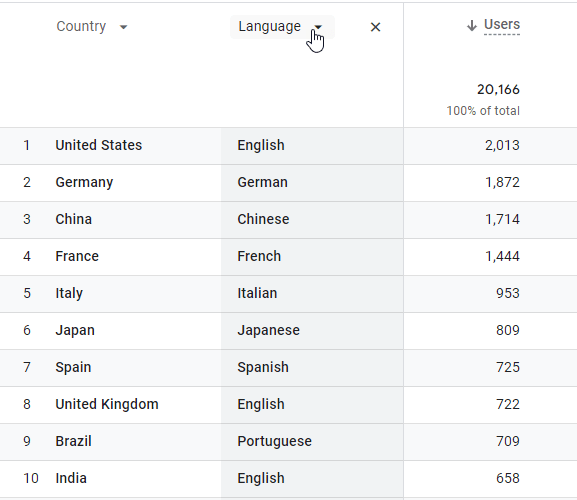
In this example: the English language is the most used because it’s in first position but also because English customers comes from the United Kingdom and India.
As you have seen, creating such custom dashboard is quite long but that maybe sufficient for a simple website. Anyway, you’re now ready to create custom reports from scratch! Access the Reports left menu to proceed.
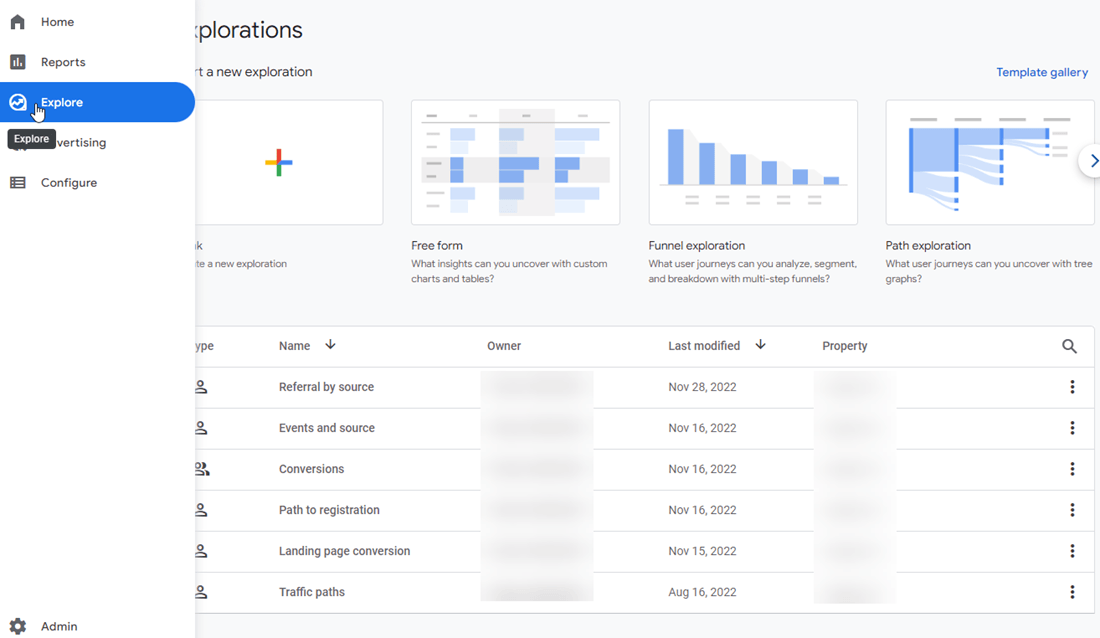
In the top menu you have a template gallery to choose from, this will be the visualization type. The choice depends on your website data, but the free form and the path exploration are the more flexible ones.
Let try a free form and load international stats in it.
There are 2 left columns to select and filter data:
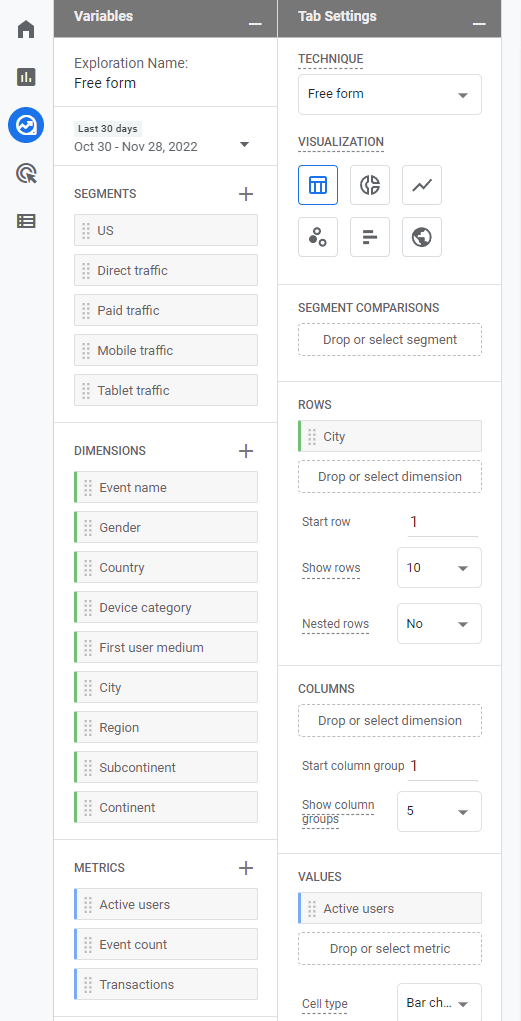
In this example: I’ve selected metrics = all active users, rows = countries + languages + language code
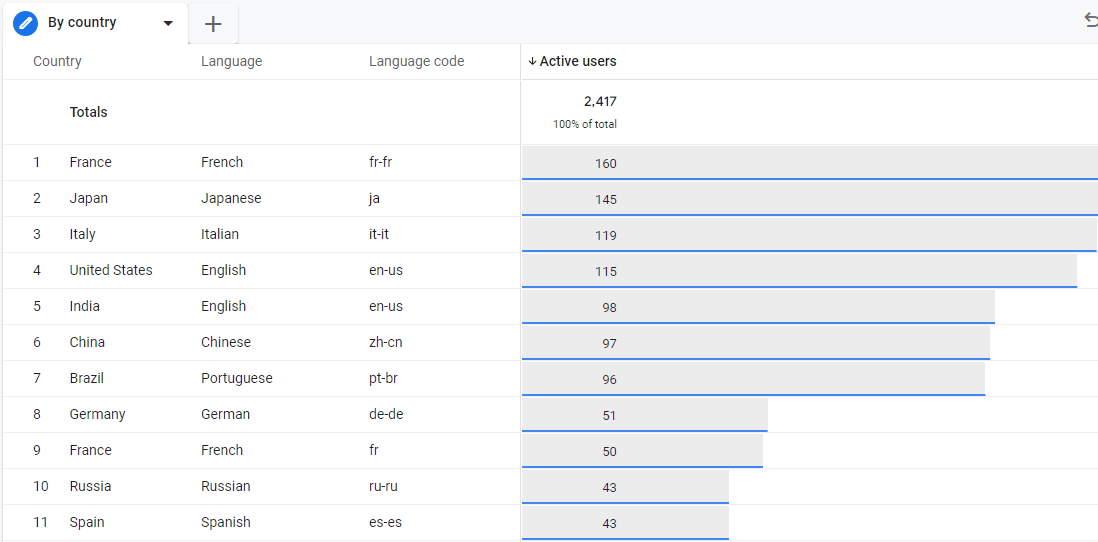
Here I’ve built a remarkable data source with all the main information for a multilingual websites. Your report is automatically saved, and you can also create different tabs inside each report.
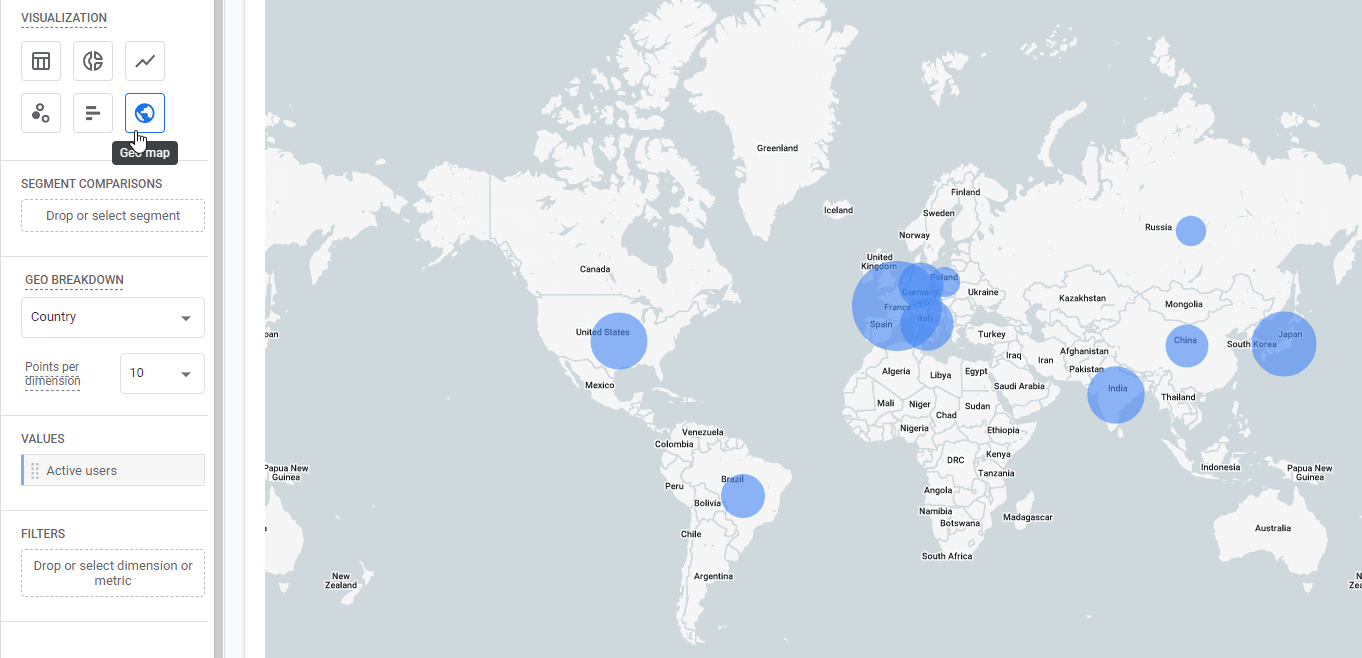
Finally, it’s worth mentioning that you have visualization option for each report for you to switch, one of them is the “geo map”.
Linguise offers some statistics on the translation dashboard, more precisely, it’s pages hits (not unique visitors).
We count a page hit each time we receive a page translation request. We don’t use the same technic to count page view. Google Analytics will do that on the user browser using JavaScript, while we do that on the server side.
Also, Google Analytics, will only count visits for visitors that have accepted your cookie sharing banner (if any), and browsers that don’t have an ads and cookie blocker. Furthermore, there are bots; we try to detect visits by bots and not count them as it. But bots can easily fake browser user agents and get counted anyway on our side.
We aim to provide the best translation service, we’re not experts in traffic statistics. Our data is here to tell you: “hey! Your translations are working great, many multilingual pages have been crawled”.

